All Blog
Intro to Understanding UTM Data
A brief breakdown of UTM reporting and using Advanced Analytics to analyze your UTM data.
Posted On June 22, 2022
Table of Contents
Introduction
As you may know, Google Analytics has an enormous amount of power under the hood. This page would be a million times longer course if we tried to cover reporting in great detail. Instead, let's look at the key things to keep in mind and from there you can explore the platform and customize it to suit your needs.
Google has added some pretty decent contextual training in recent years that teaches you how to get the most out of the platform. When many people started with Google Analytics, they had to do a lot of guessing and checking! If you want to get a deeper dive into using the platform, we recommend their tutorials.
Standard Reports

The ‘All Campaigns’ report is where you’re going to want to get started.
This report will show you all your key metrics grouped by whatever UTM tag you like. You can also use the highlighted ‘Secondary Dimension’ to group your data together quickly for analysis.
For example, you could use this report to look at all traffic grouped by Campaign Source and Campaign Name. If you have an affiliate program for your new book, you might see Campaign Source ’affiliate’ and Campaign Name ‘book+launch’ and from there you can see exactly how many downloads came from your affiliate promotions.
Notice that inside Google Analytics, your ‘+’ marks will be replaced with spaces – making everything much easier to read. This is why UTM formatting and consistency is so important!
Segments
One of the most powerful features within Google Analytics is the segmentation options shown at the top of your reports.
Segments refer to a group of sessions (or users) that meet a set of criteria. Google Analytics comes with a heap of useful defaults, but the real power is being able to create your own segments. These “custom segments” mean you can slice-and-dice your data to answer virtually any question you may have.
When using the segments feature, you’re able to view any report within Google Analytics (including custom reports) showing only data belonging to the segments you’ve selected. This allows you to dig into all sorts of information that would otherwise be hidden in averages. This kind of advanced analysis will help you make more informed marketing decisions, so I’d definitely recommend investing the time.
Session Segments vs. User Segments
You can decide whether your segmentation rules are defined by the session or the user. What does this mean?
Imagine you had a physical store. In your store, a session would refer to an individual person’s trip to your store. If they come back to the store tomorrow, that will be a different session even though they’re the same person. A user would refer to the individual, and any analysis of that person would pull from all their individual sessions (visits to your store).
The ability to choose between sessions and users means you now have a bunch of new options including the capacity to look at people that were exposed to a campaign but didn’t buy/convert in that first session.
Custom UTM Segments
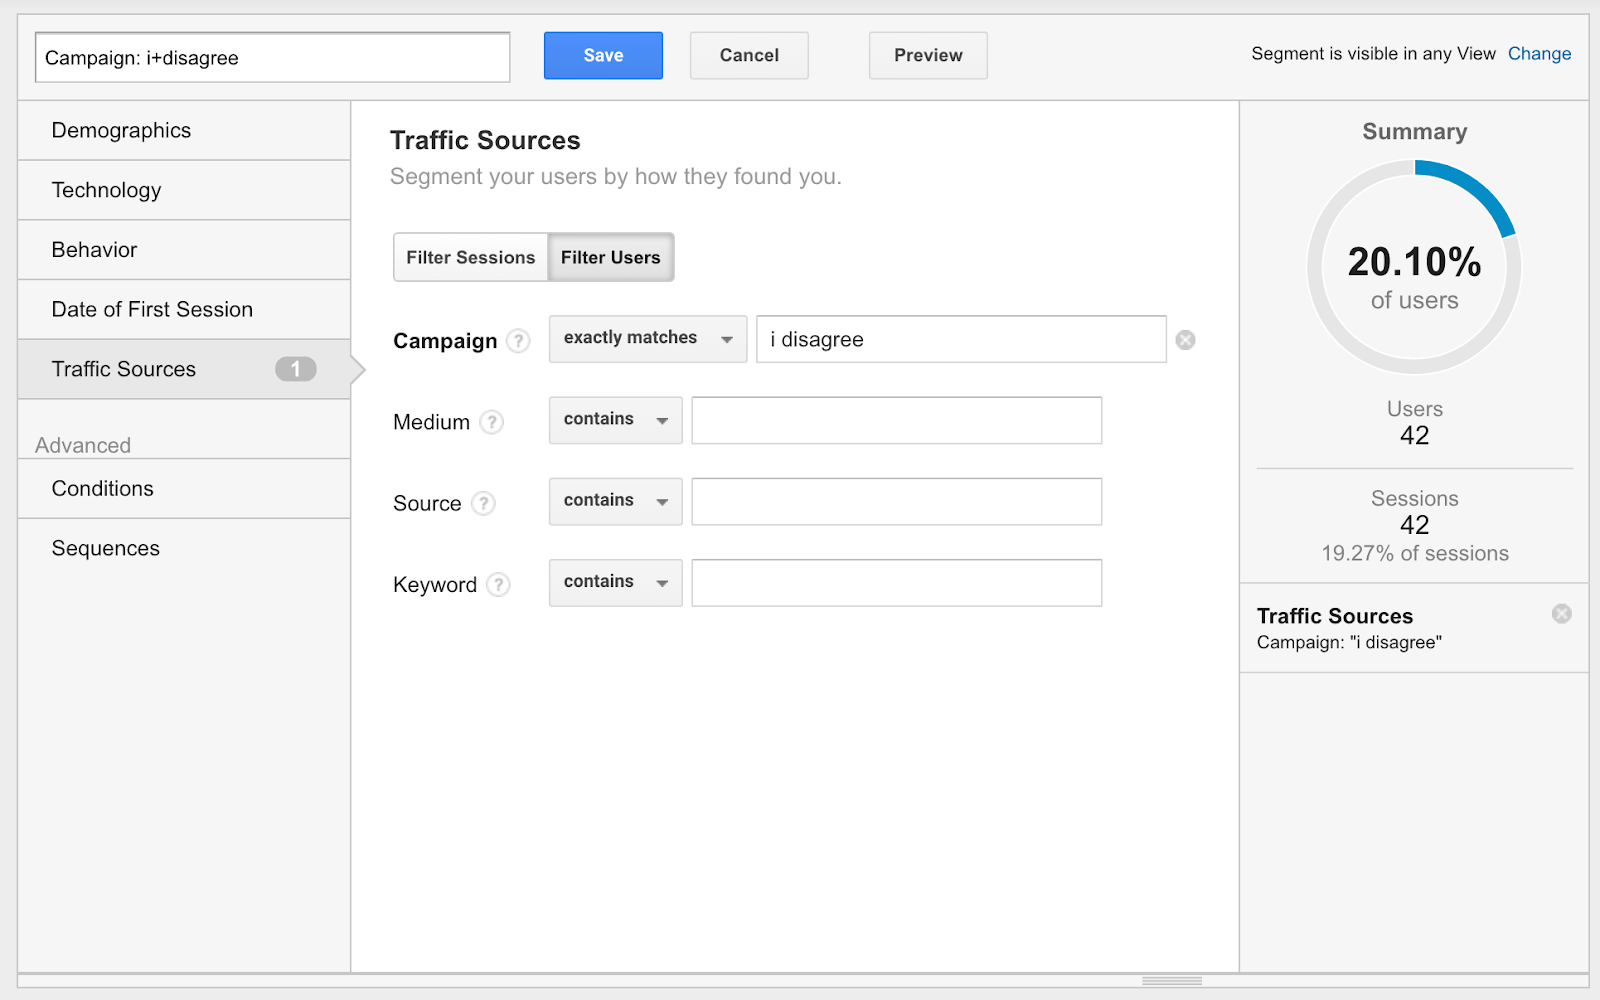
Custom segments allow you to create segments based on any combination rules (there are loads of options you can explore in your account). In our case, we can use the data collected from our UTM Tags.
Let’s walk through an example. You want to know how each of your traffic sources performed in an eBook Promotion campaign.
I just ran a mini promotion for an eBook, so I’ll walk you through with some real data.
The first step is to create a segment based on Campaign Name.

throwback
There’s a lot you can look at now that you have this segment, including creating segments for other campaigns to see how different campaigns impact other metrics.
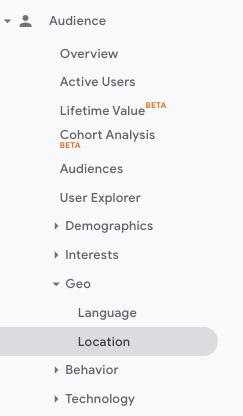
For the sake of demonstration, let’s quickly look at what countries our initial traffic came from:

That’s interesting, but wouldn’t it be more useful if we could see this information based on which traffic source these visitors came from? Well, we can do that by using something called the ‘secondary dimension’.

This is just a simple example, but there’s a lot of options available to you now that you understand how to create custom segments, so spend the time to think about how you can draw useful information from your reports using Custom Segments.
Get your free Google Analytics dashboard
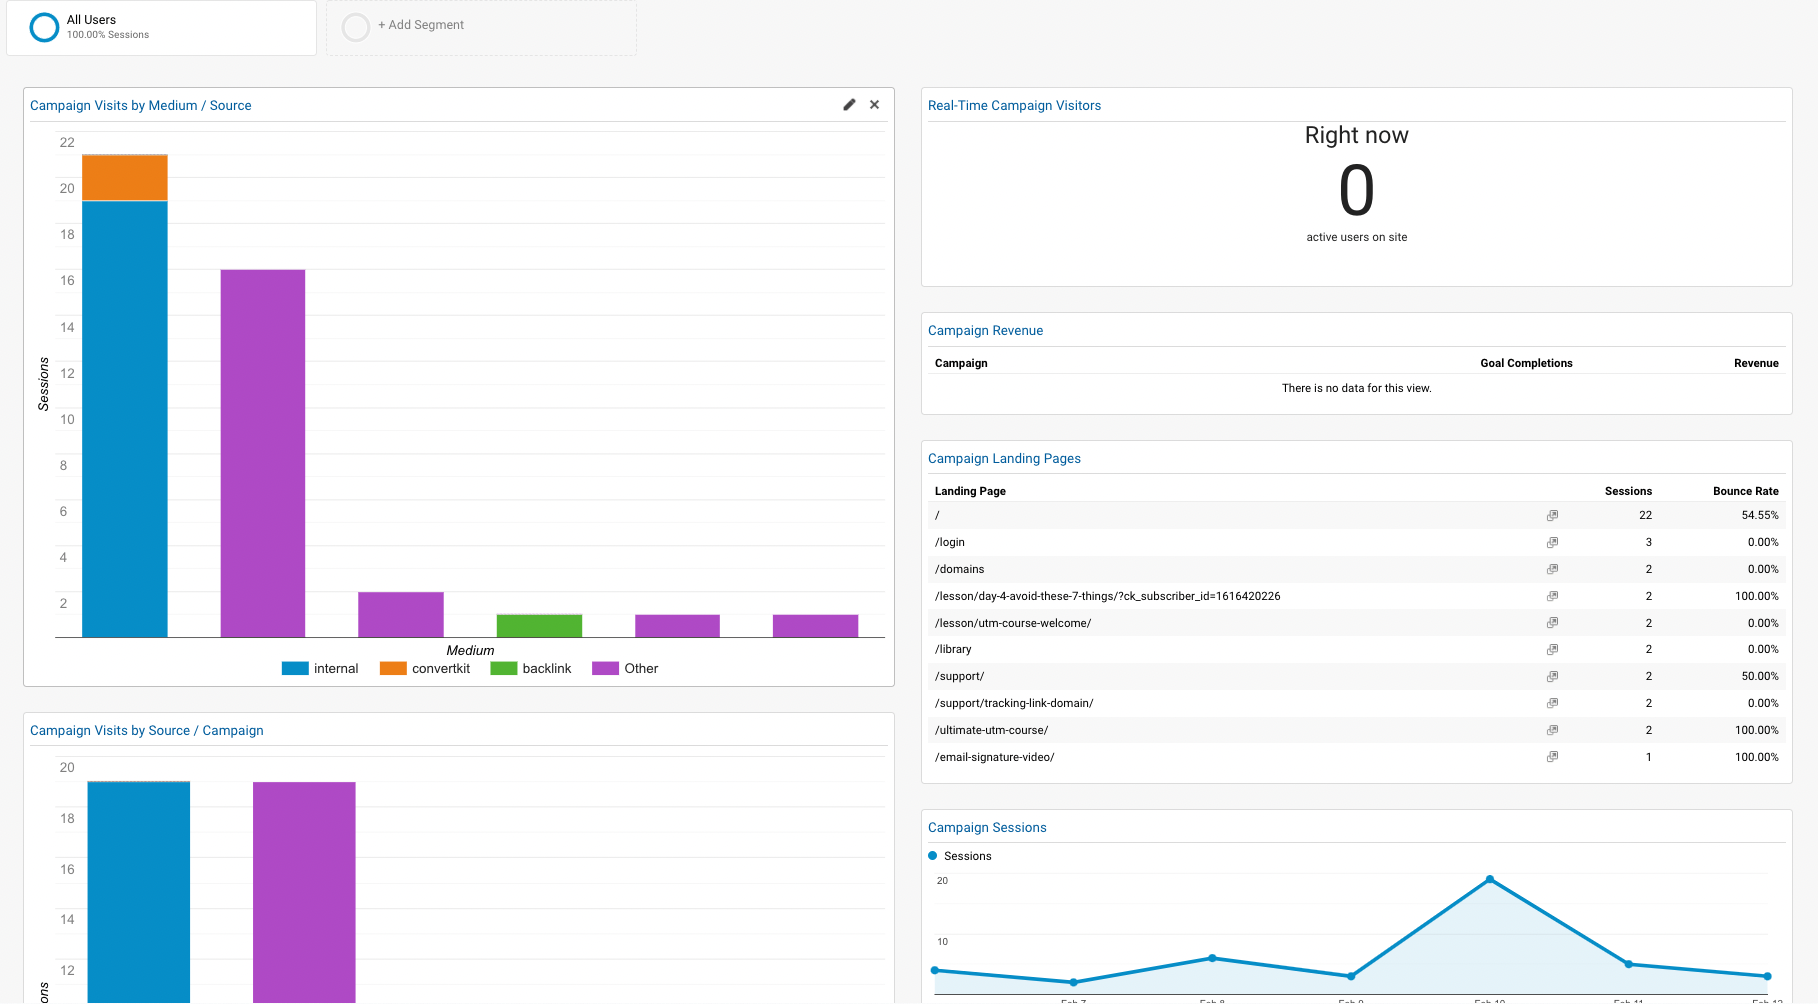
Google Analytics has the ability to build custom dashboards. Below is a screenshot of what our UTM dashboard looks like. If you’d like to use it yourself, please complete the form and you will instantly get the link.

Unlock UTM Mastery: Your 5-Day Roadmap to Marketing Precision!
From creating tracking links to decoding your data, unlock the marketing insights you've been missing out on.
Register now


